
- Seawater temperature in intertidal zones is influenced by sediment temperature variations and is highly sensitive to tidal cycles.
- Understanding the spatial and temporal variability of sediment temperature in intertidal zones is necessary, but currently limited due to difficulties in making in-situ observations.
- High-resolution sediment skin temperatures over the tidal flats were estimated using Landsat 8-9 OLI/TIRS Collection 2 Level-2 imagery.
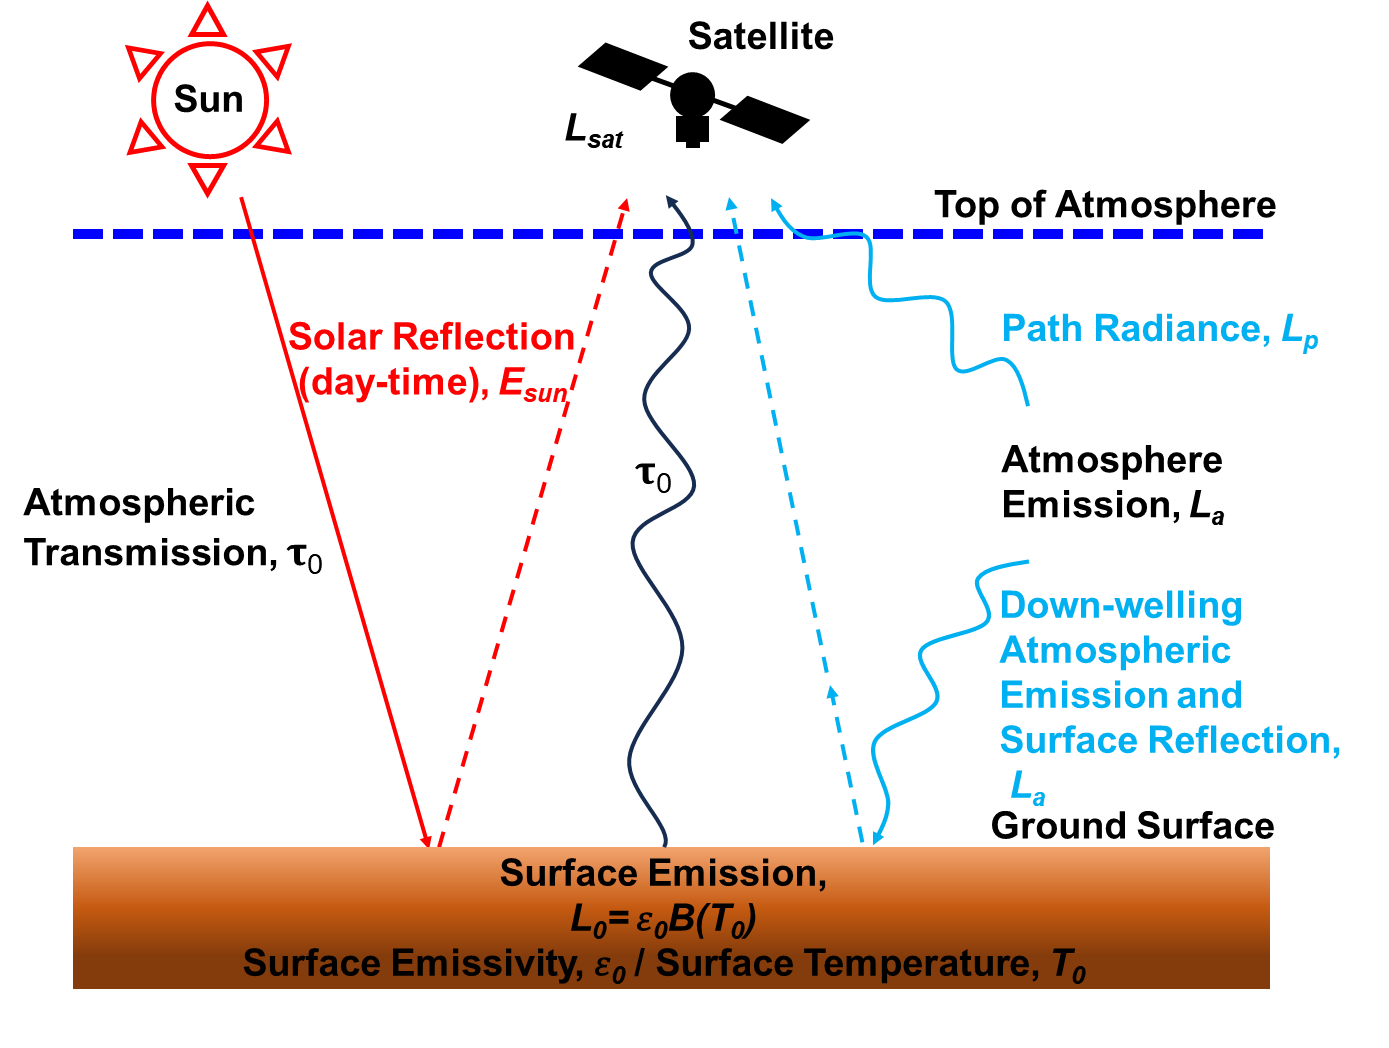
Figure 1. Schematic diagram of the radiative transfer model illustrating the process by which radiative energy emitted from land surface reaches the satellite. Estimating land surface temperature from satellite thermal infrared data requires corrections for surface emissivity, atmospheric transmittance, upwelling and downwelling radiance, and solar reflection.
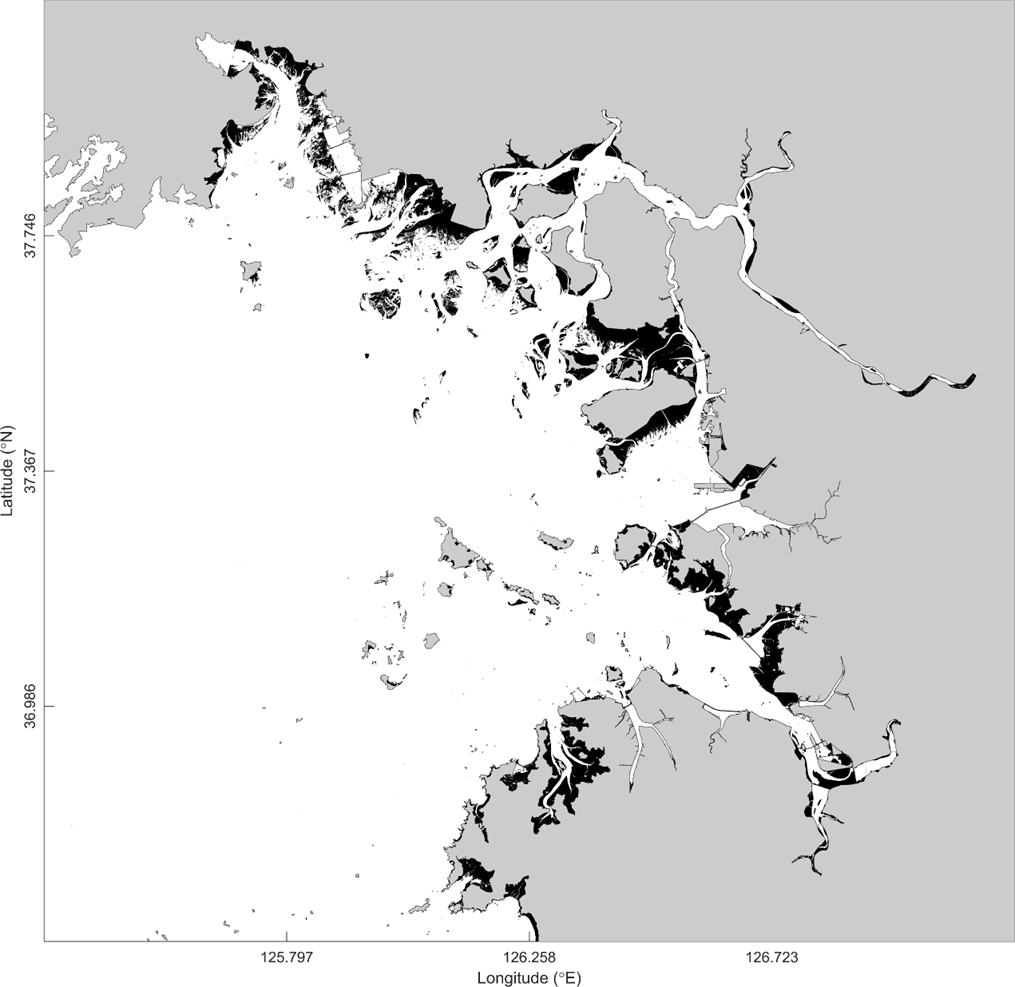
Figure 2. The intertidal zones (Black areas) in Gyeonggi Bay identified are determined by the Normalized Difference Water Index (NDWI) of satellite data.
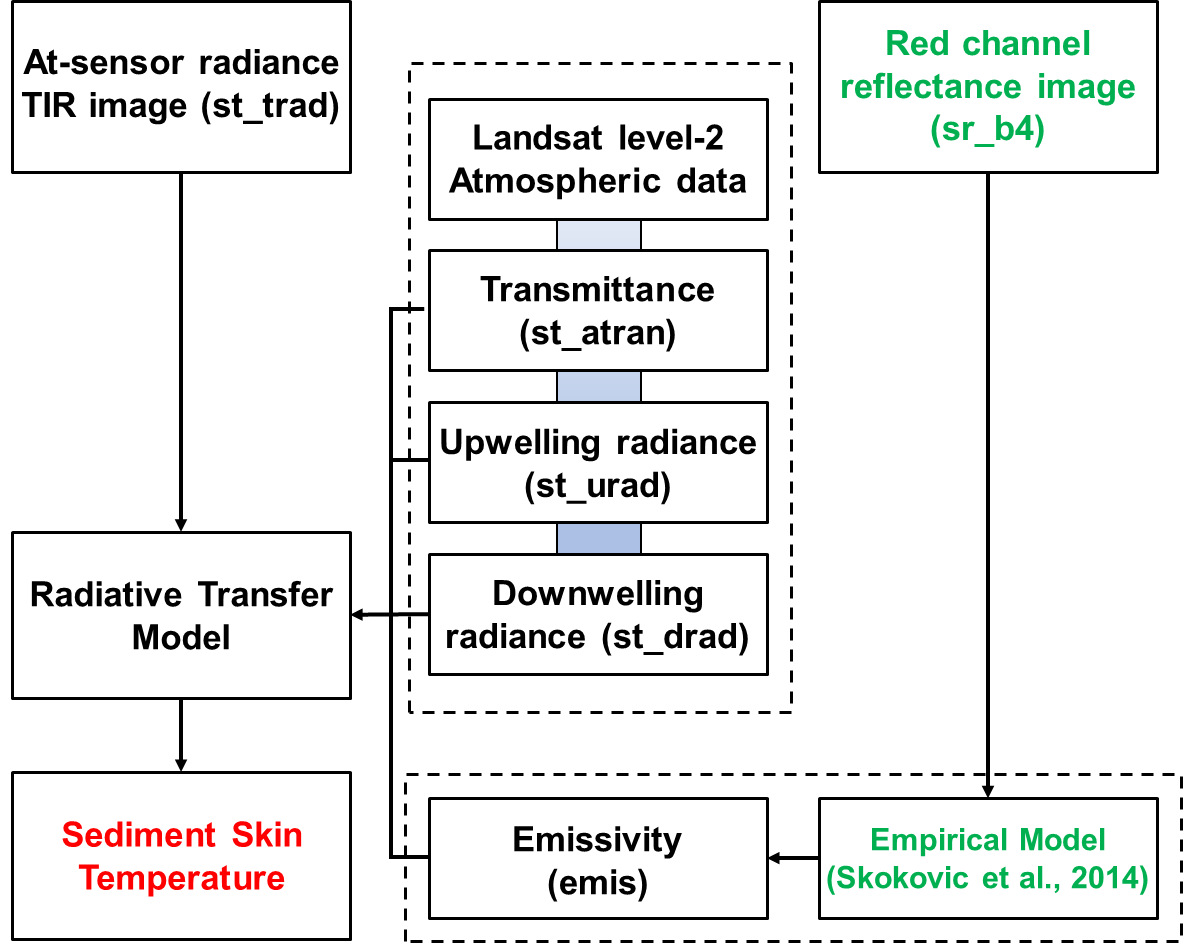
Figure 3. Flowchart for surface emissivity correction and sediment temperature retrieval for tidal flats using Landsat Level-2. Emissivity of tidal flats is estimated by the empirical model presented in Skokovic et al. (2014).
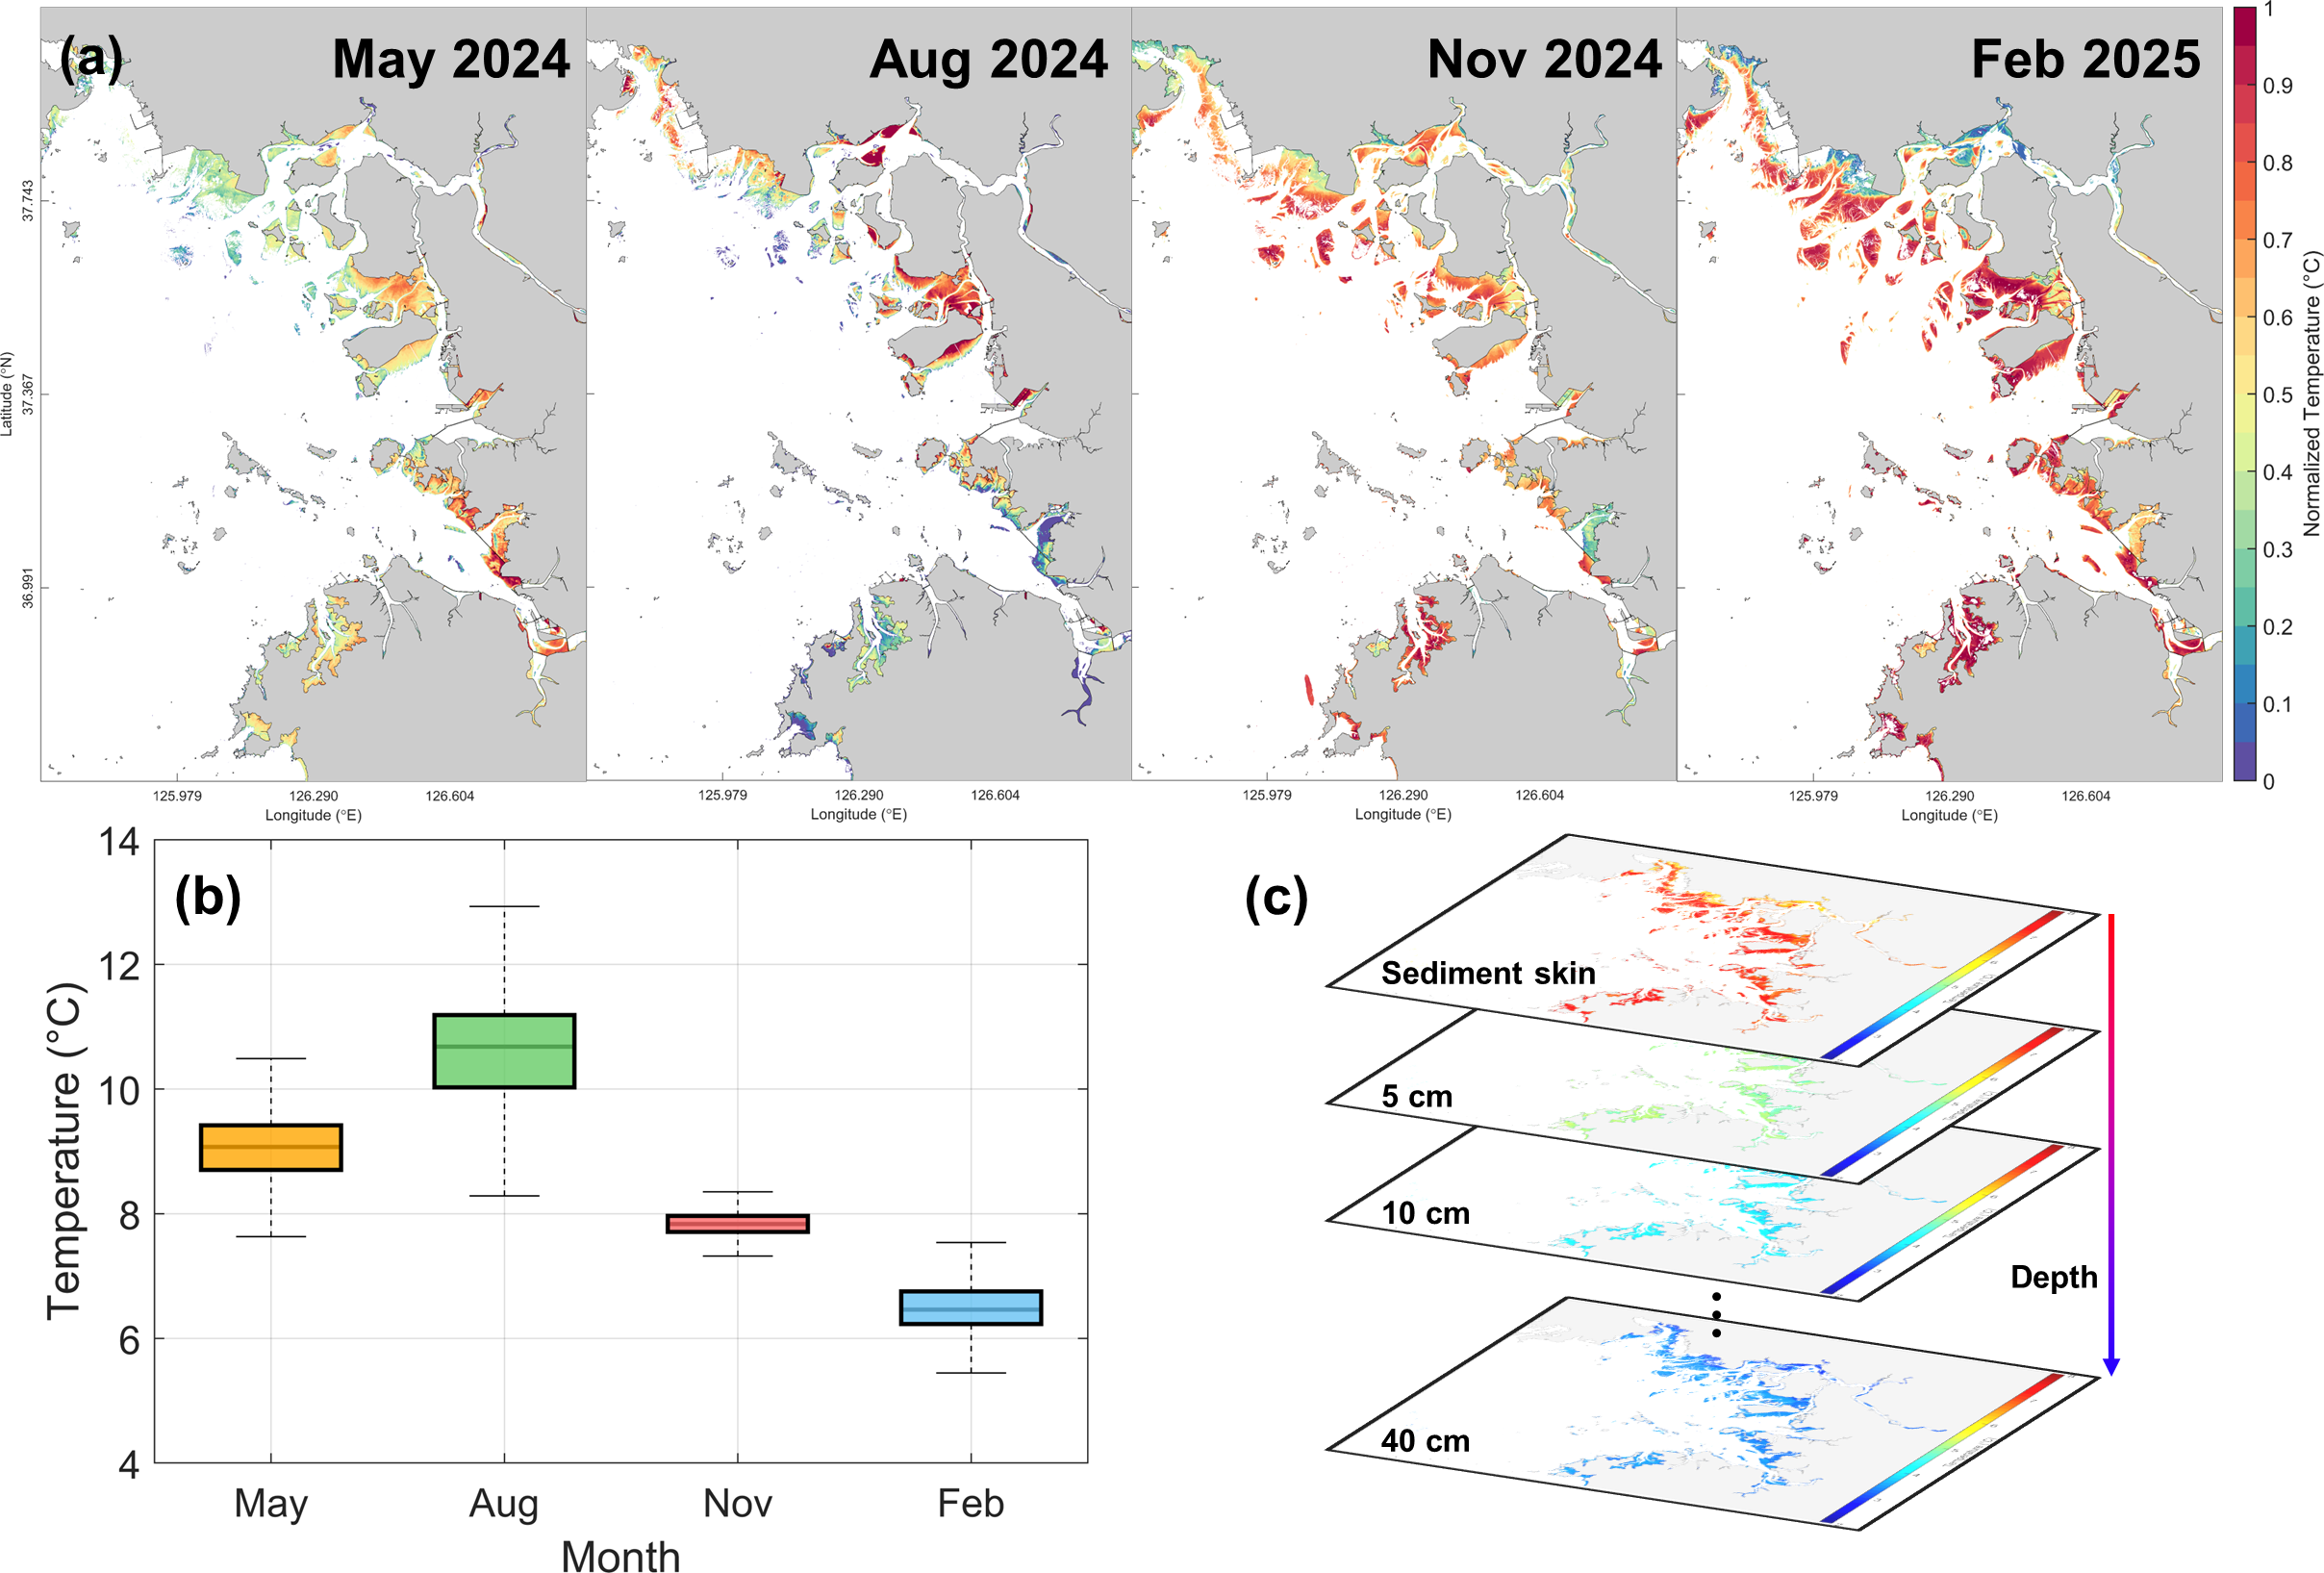
Figure 4. Spatiotemporal variability of sediment temperatures in intertidal zones. (a) Normalized sediment skin temperatures estimated from Landsat imagery for May, August, November 2024, and February 2025. (b) Sediment skin temperatures distributions corresponding to observation dates in (a). (c) Sediment temperature fields at multiple layers derived by depth-dependent temperature attenuation rates. The maximum seasonal temperature difference is 8°C, and sediment temperature decreases with depth.
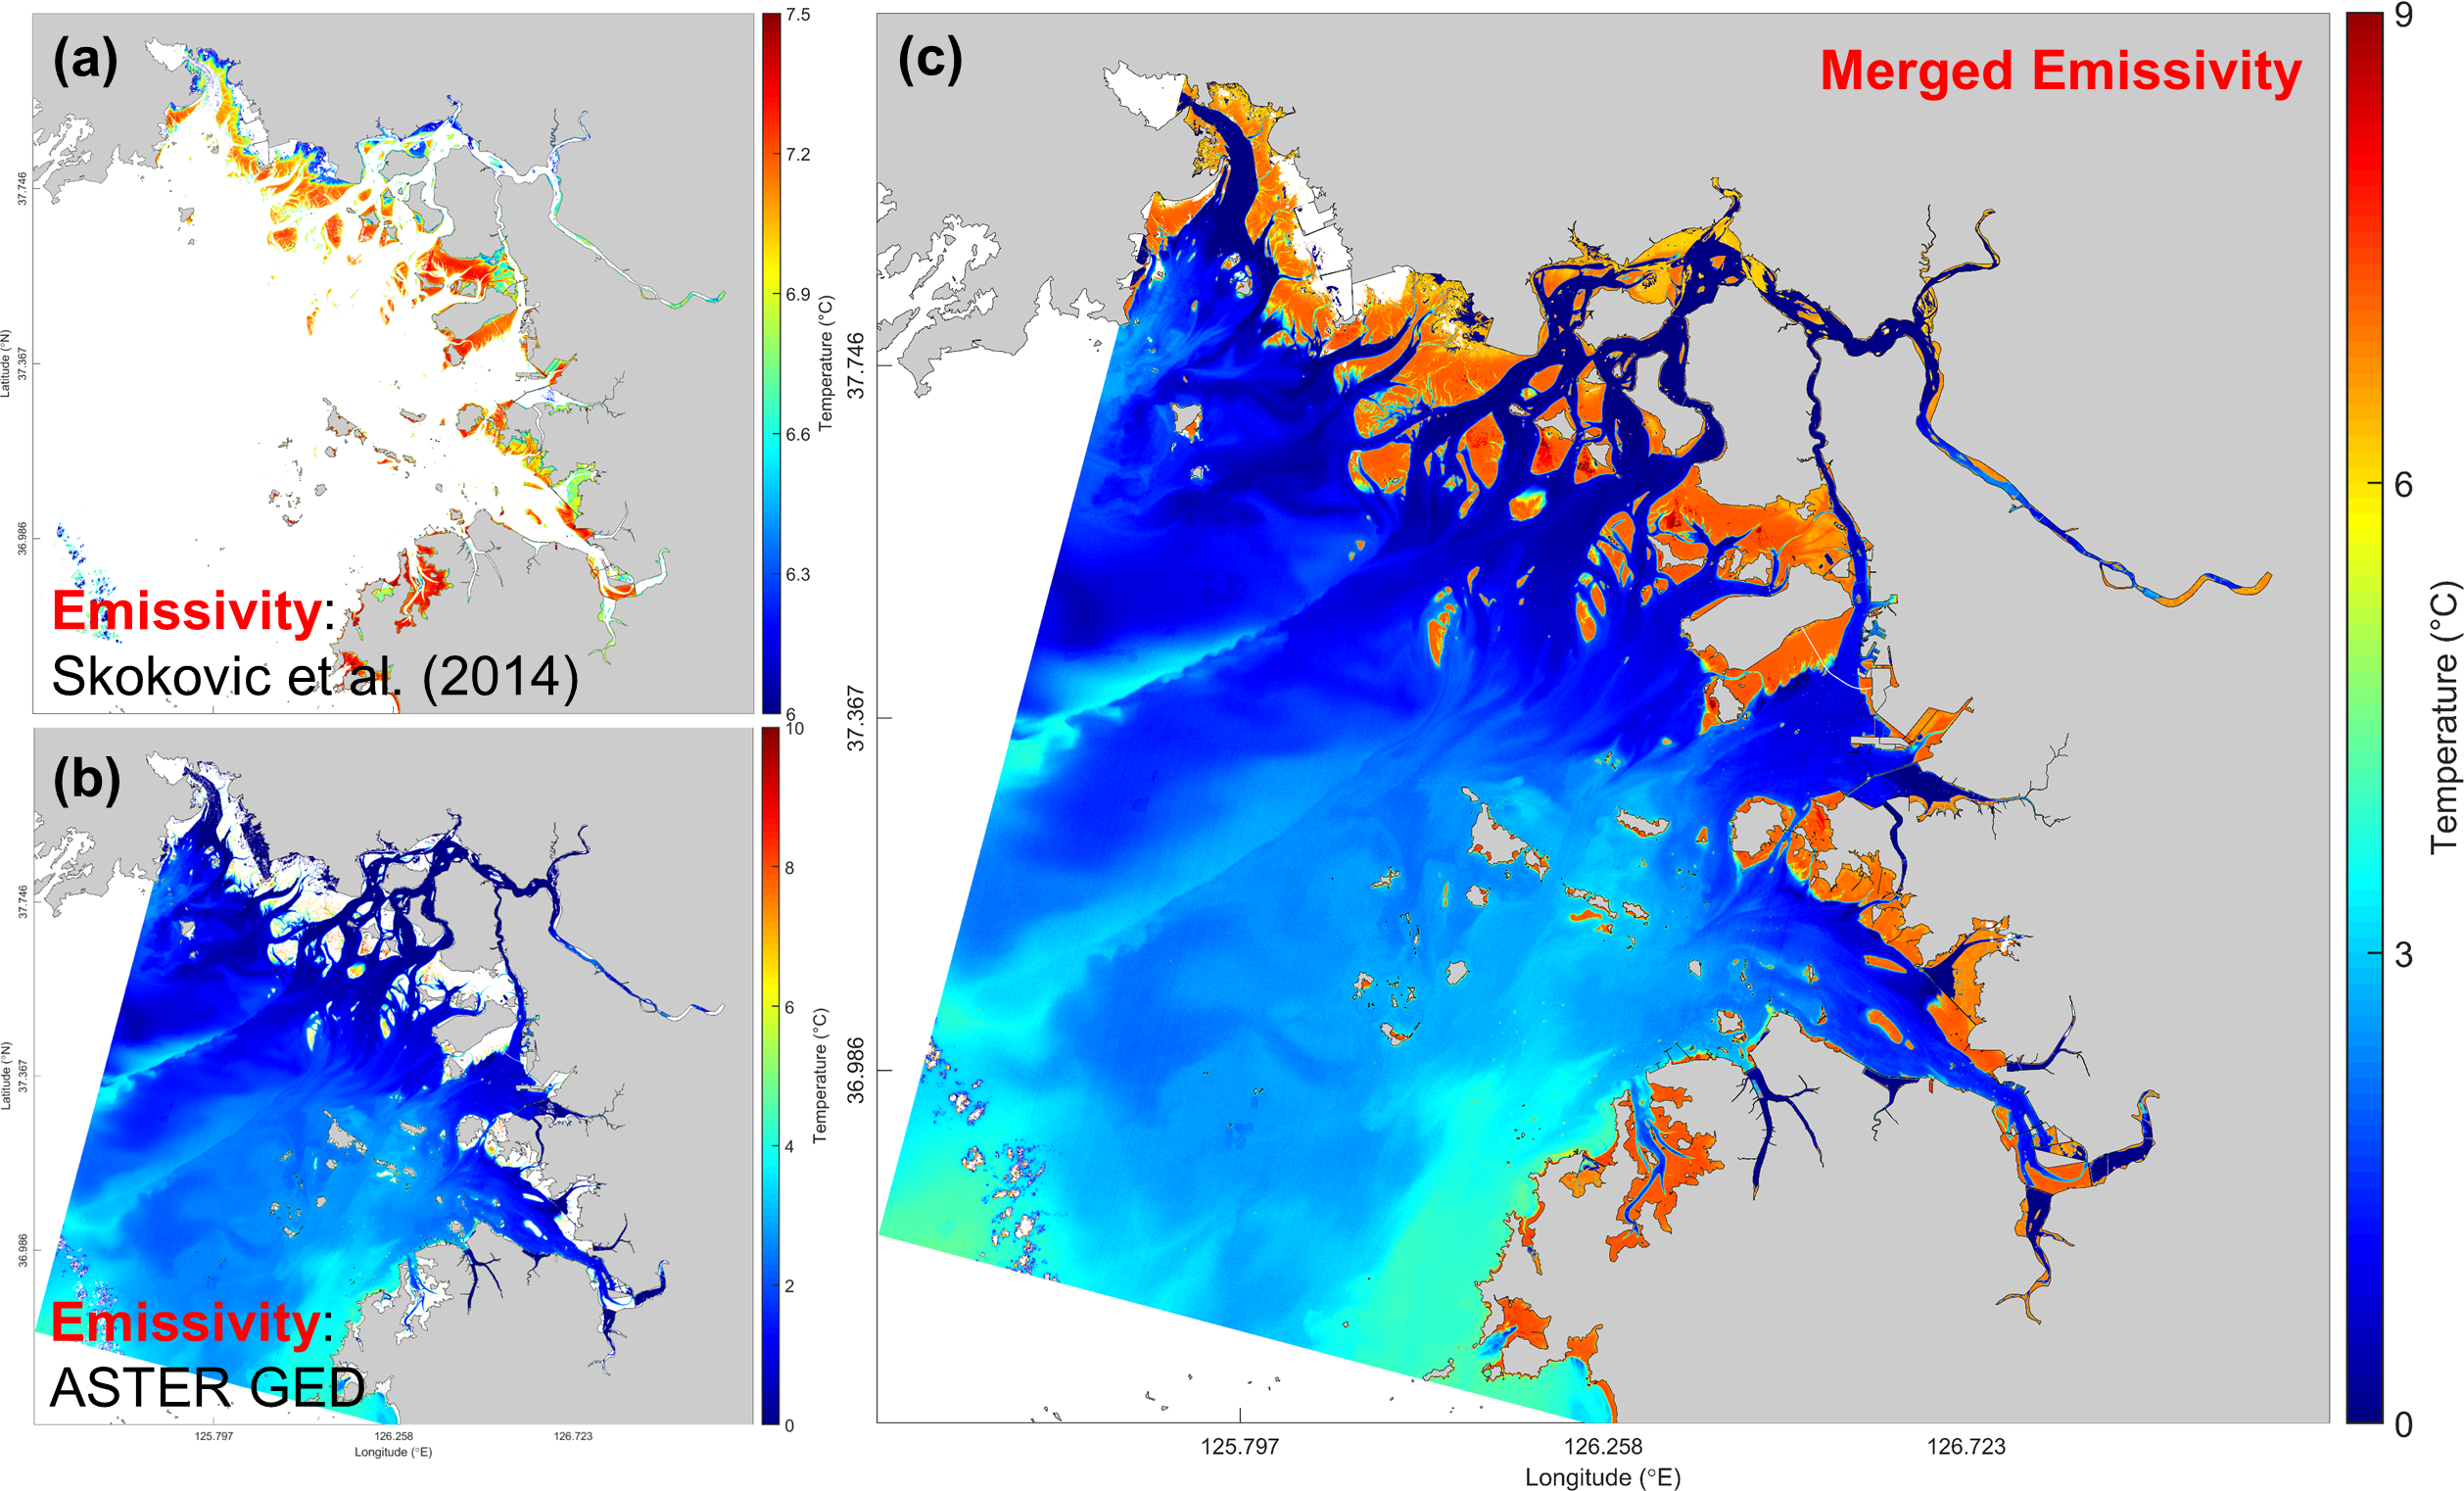
Figure 5. Surface temperatures of inter- and sub-tidal zones derived by different emissivity datasets. (a) Sediment skin temperature estimated by the empirical emissivity model. (b) Sea surface temperature (SST) derived by the ASTER Global Emissivity Dataset (GED) from Landsat Level-2. (c) Spatial field combining sediment skin temperature and SST. In (c), there is a distinct difference of approximately 6°C between the sediment skin temperature and the SST.
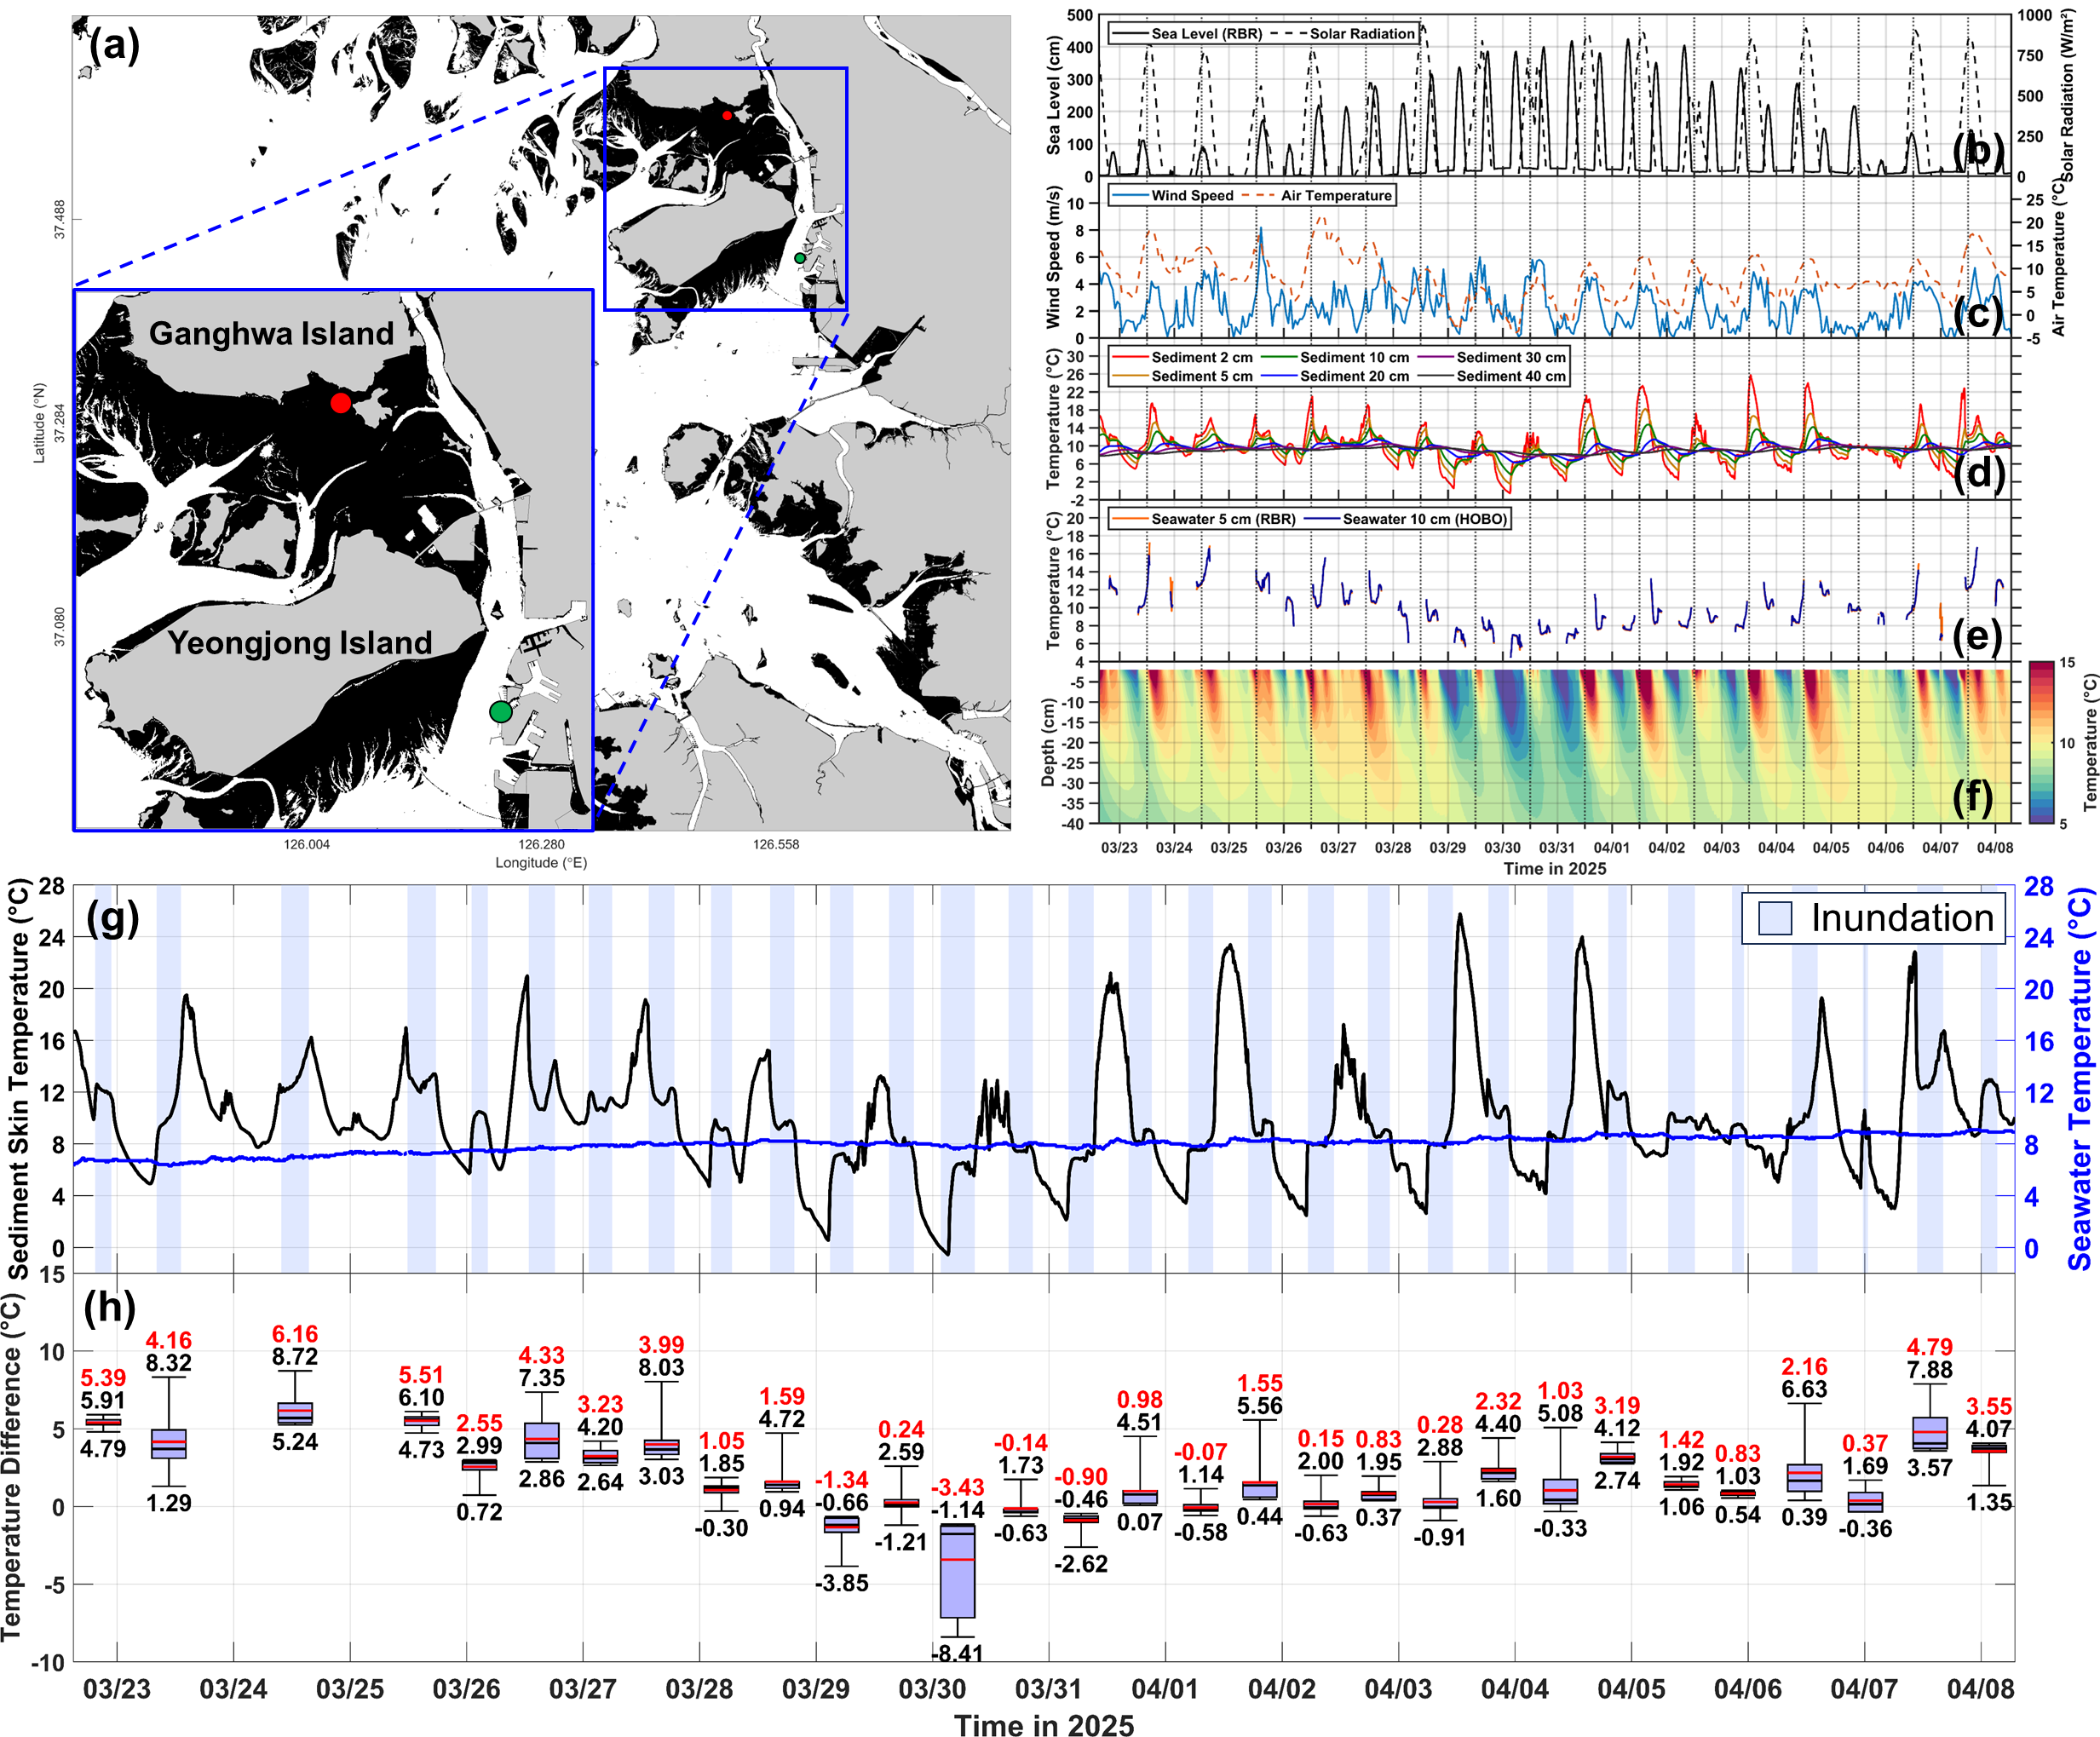
Figure 6. (a) Map of the study area showing observation point (M1, red circle) and Incheon tide station (green circle) on the southern part of intertidal zone in Ganghwa Island. Time series data from a M1: (b) sea level (solid line) and solar radiation (dashed line), (c) wind speed and air temperature, (d) sediment temperatures at depths of 2, 5, 10, 20, 30, and 40 cm, and (e) seawater temperatures at 5 and 10 cm above bed. (f) Spatiotemporal variation in sediment temperature. (g, h) Comparison of temperature between inter- and sub-tidal zones. In (h), the red text denotes the mean value. The black texts at the top and bottom of the boxplot indicate the maximum and minimum values, respectively.
High-resolution sediment temperatures in the intertidal zone was estimated using satellite data, revealing a distinct difference from sea surface temperature. Combining satellite data with in-situ temperature data enabled estimation of vertical sediment temperature profiles, allowing assessment of sediment thermal properties and spatiotemporal interactions between seawater, atmosphere, and intertidal zone. Given the distinct seasonal variability, these results should be considered in the spatial interpretation of SST and in the initialization of numerical models.
- Project
- Advancing Coastal Water Temperature Prediction by Linking Satellite and In-situ Observations of Tidal Flat Thermal Properties
- Funded by
- National Research Foundation of Korea (NRF)