
- Gyeonggi Bay model includes tide stations, M01 mooring, and Ara gate discharge
- Monthly means show Ara gate/Han River ratio rises in winter, boosting impact
- Discharge alters residual currents and vertical flow near P1 (surface/bottom)
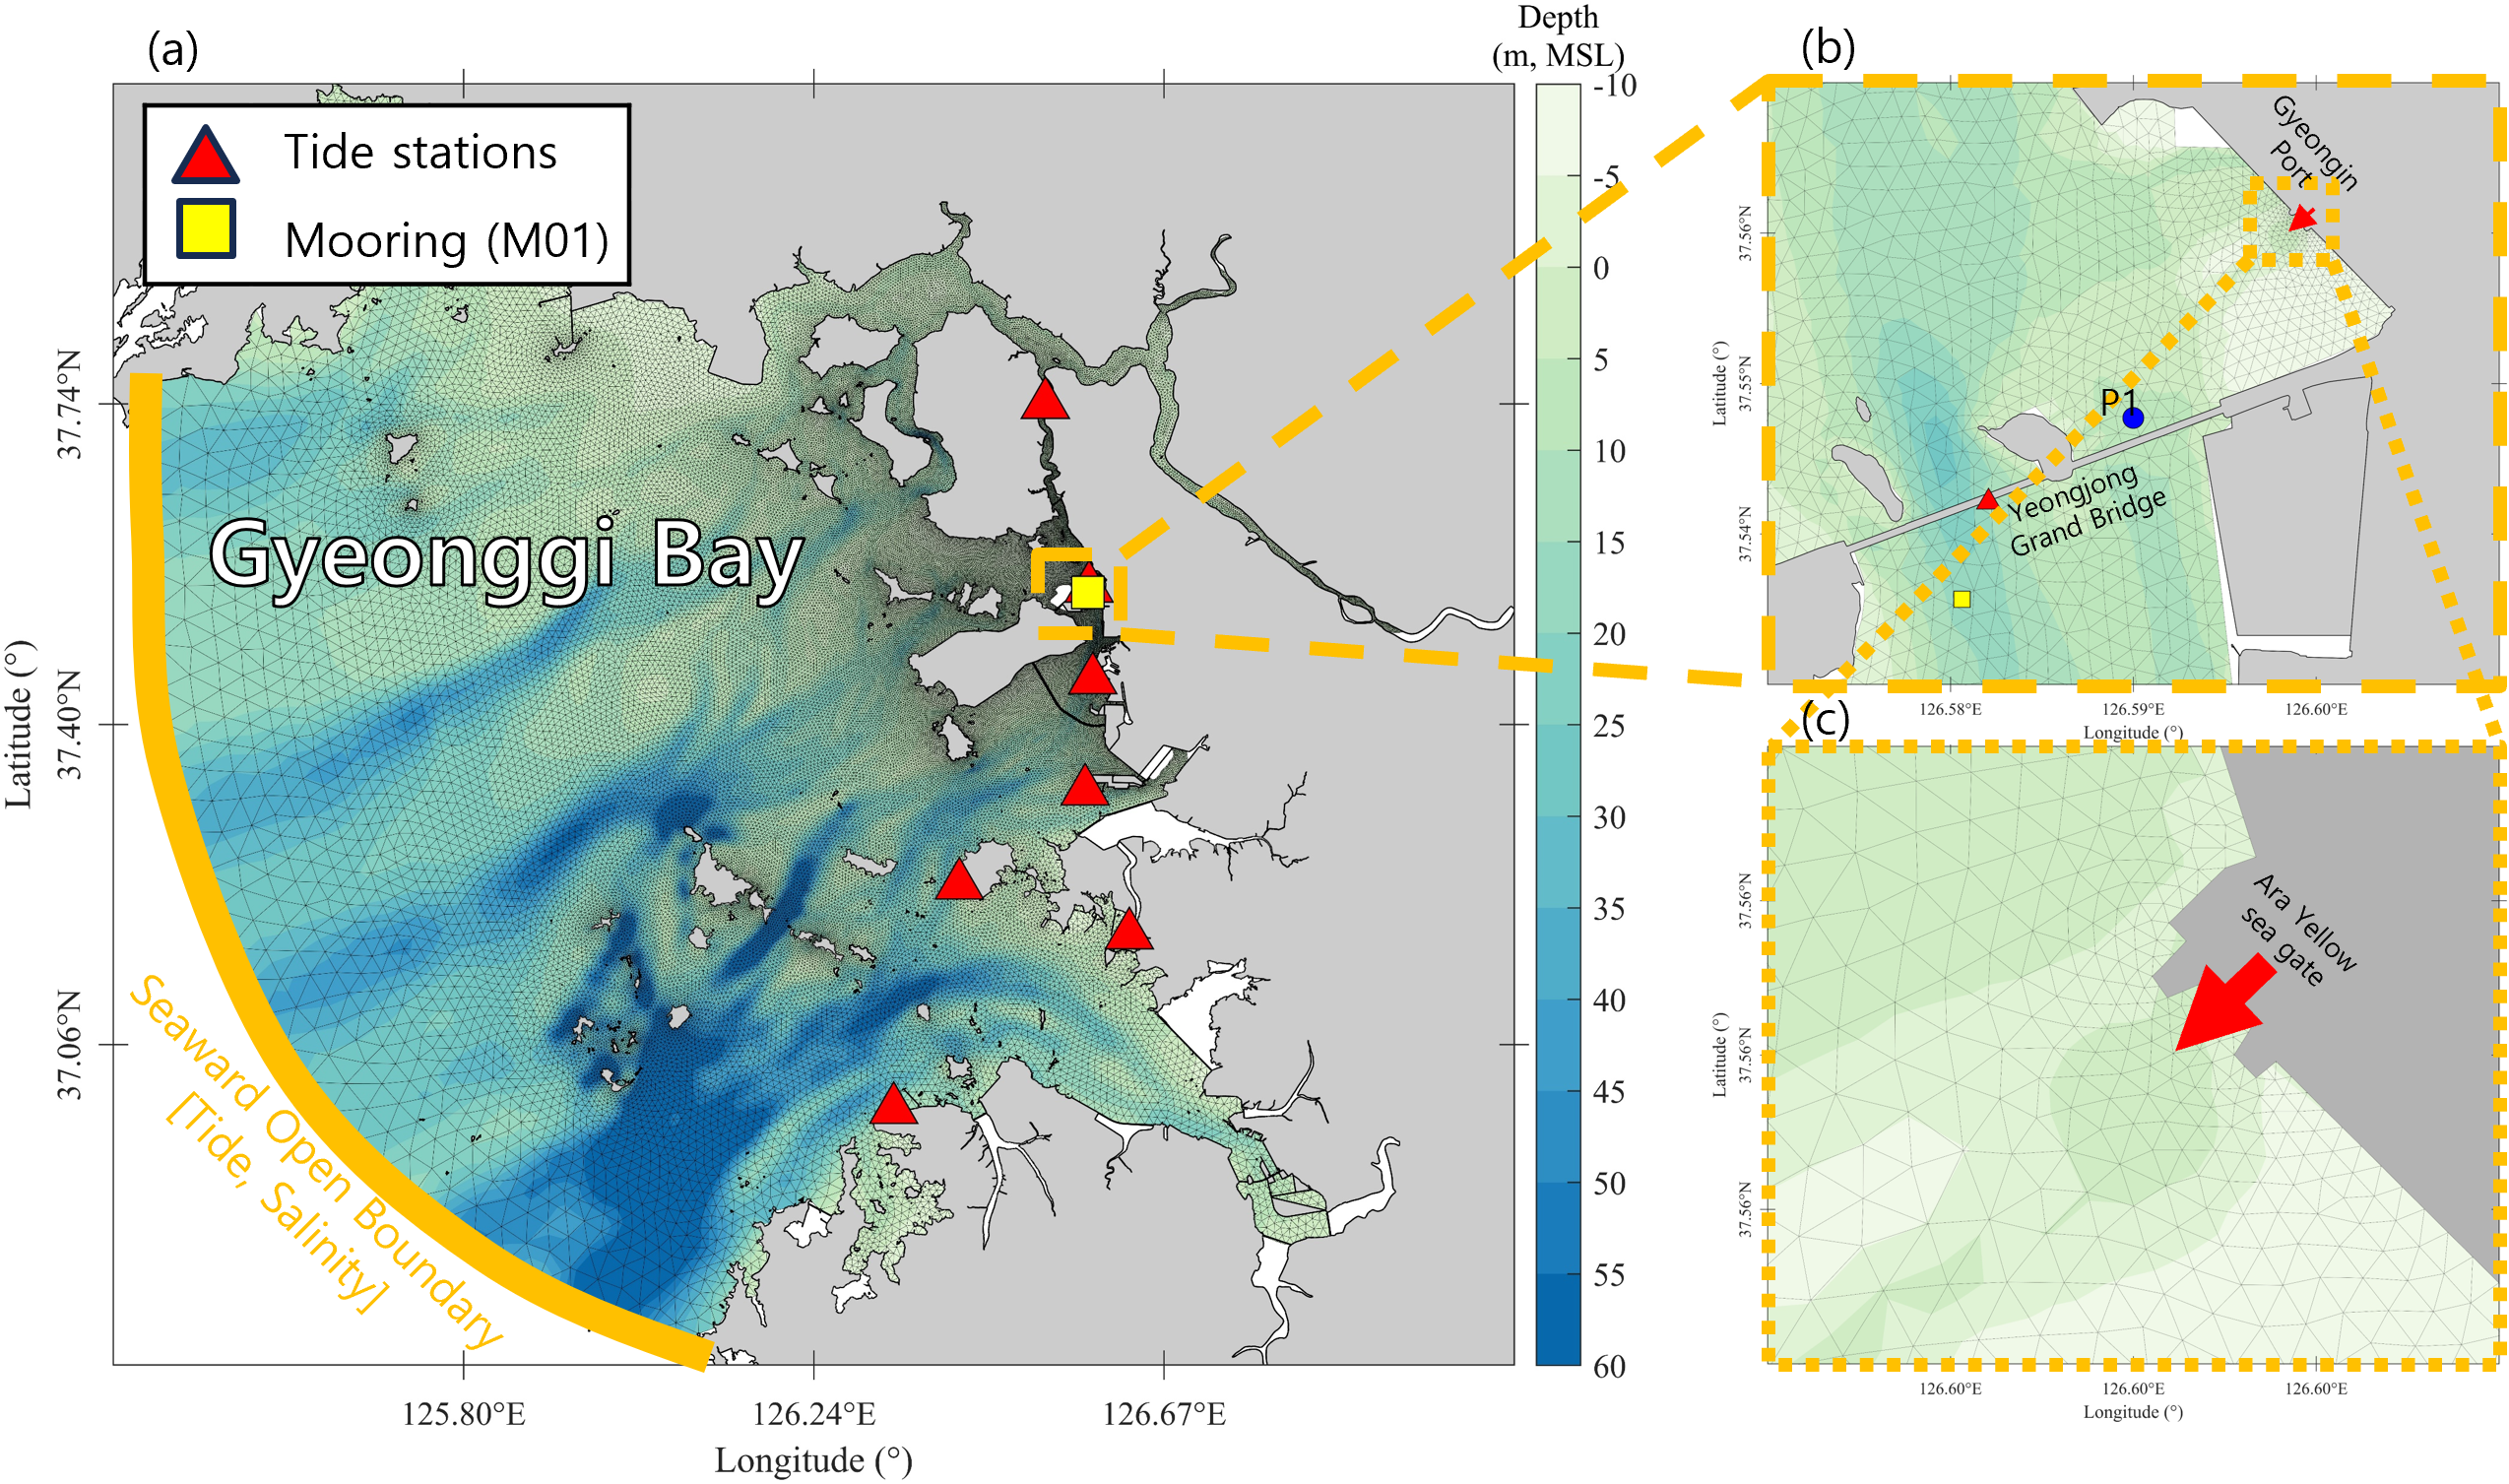
Figure 1. (a) Map showing the model domain and bathymetry for Gyeonggi Bay, (b) enlarged grid of the regions around Gyeongin Port, and (c) near the Ara Yellow sea gate. In (a) and (b), red triangles indicate tide stations. Yellow square indicates the mooring (M01). In (b) and (c), the red arrow indicates the direction of water discharge from sea gate.
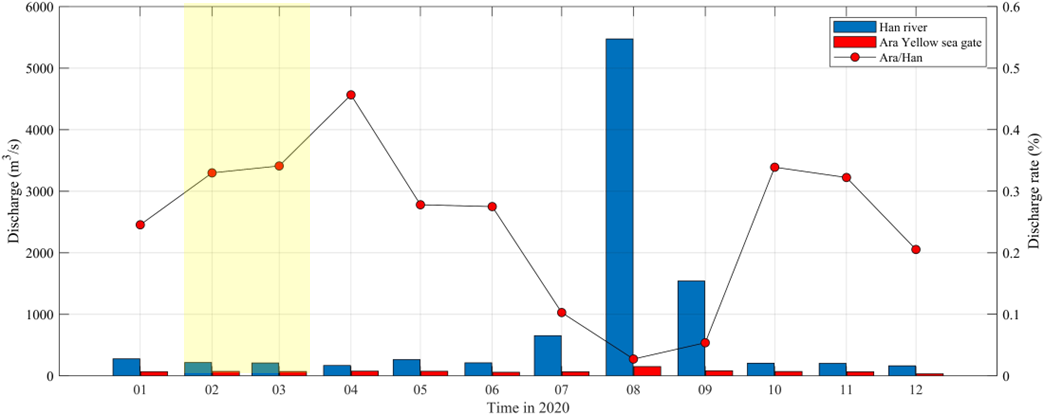
Figure 2. The blue and red bars represent the monthly mean discharges from the Han river and the sea gate. Black solid line indicate the ratio of Ara sea gate and Han River discharges. The influence of the discharge from the sea gate increases during the winter period.
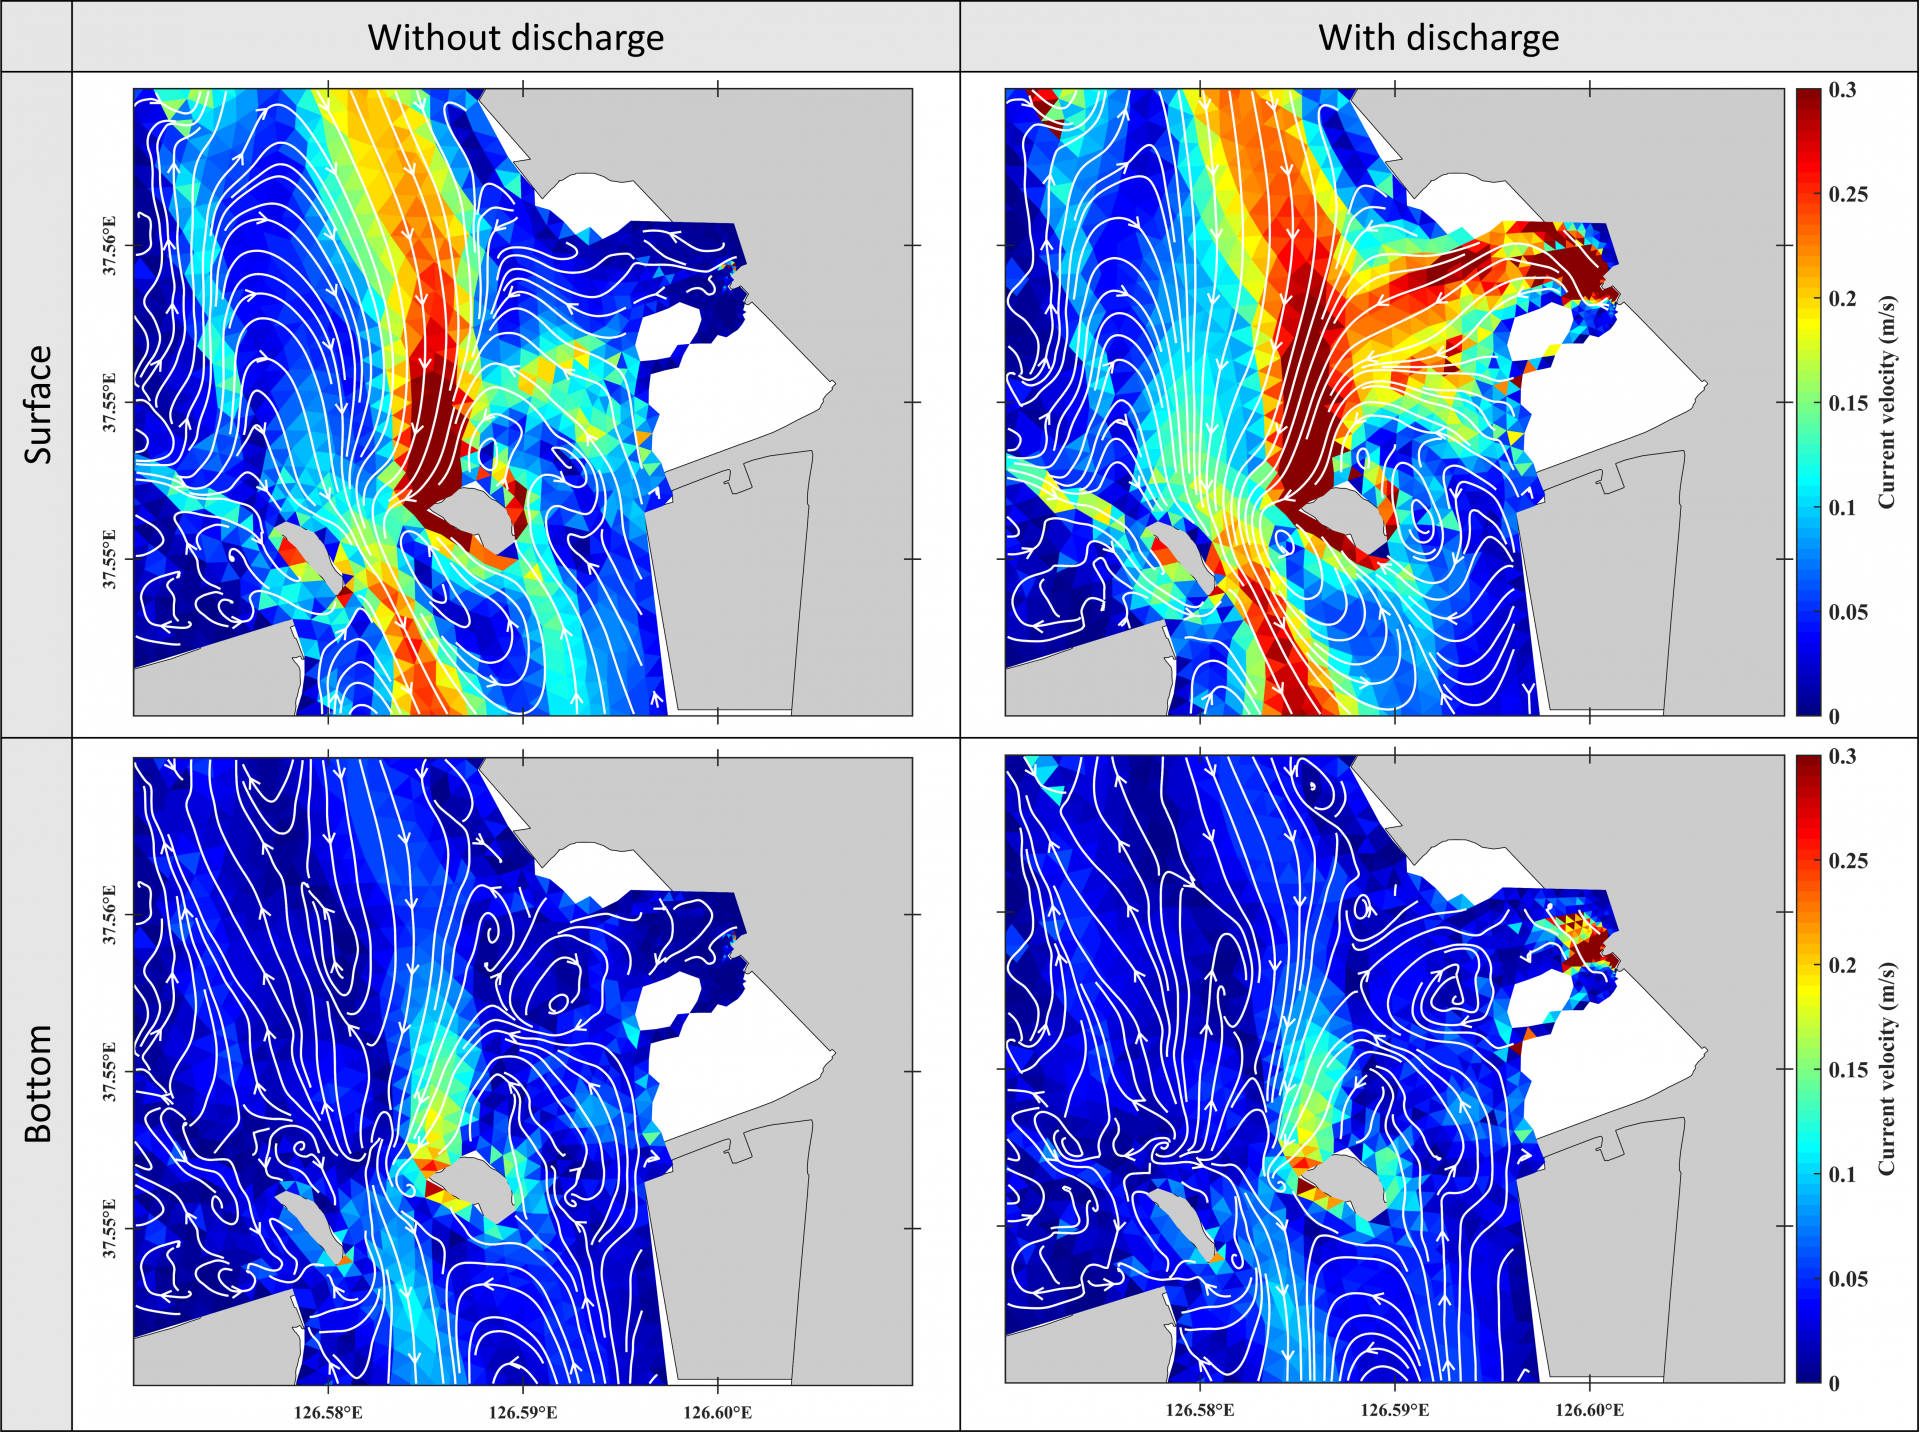
Figure 3. Time average model results in current velocities over 40 days. (a) and (c) represent the results at the surface and bottom layers without the application of the sea gate, while (b) and (d) represent the surface and bottom layers with the application of the sea gate. Red circles show the analysis regions (near the P1). The white streamlines indicate the flow patterns.
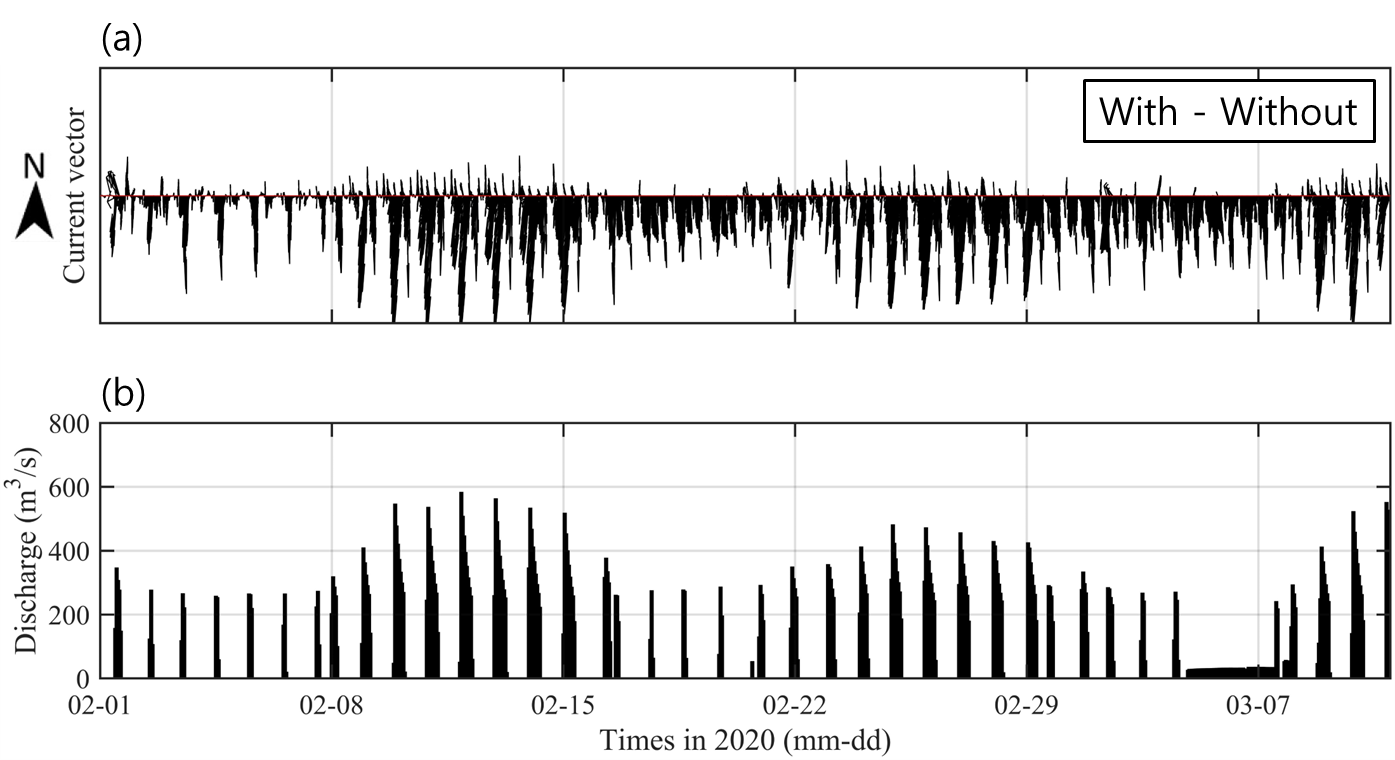
Figure 4. (a) Difference of residual current vector at P1 (blue circle in Figure 1b) between with and without the discharge. (b) Water discharge from the sea gate.
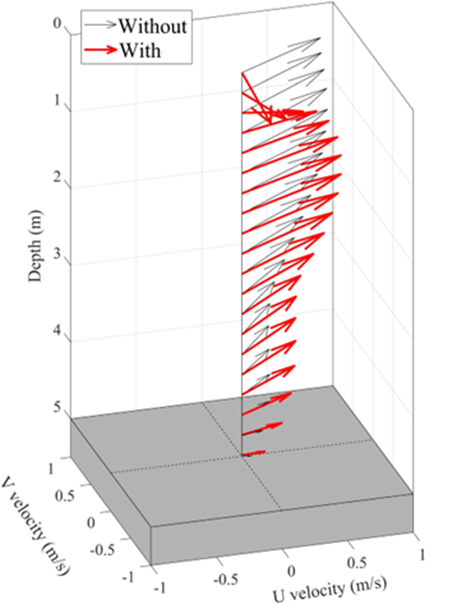
Figure 5. Time average over 40 days for the vertical residual current velocities at P1 with and without the discharge from the sea gate.
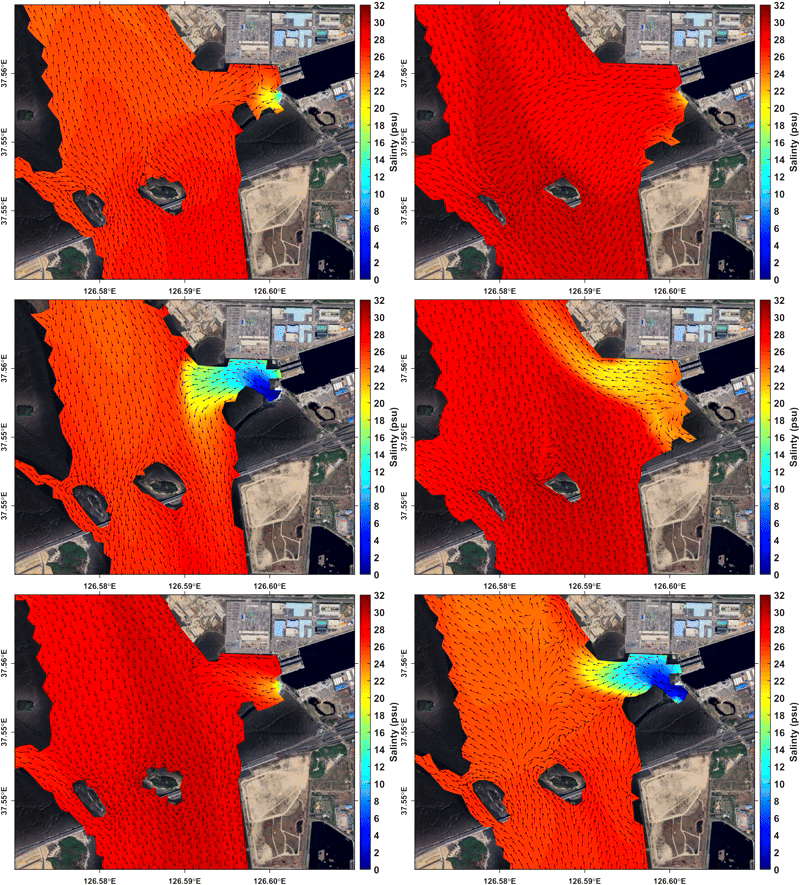
Figure 6. Model-simulated surface salinity distribution (shading) and surface current vectors (arrows) during discharge from the Ara West Sea sluice gate. Low-salinity water develops near the gate and spreads into the adjacent coastal area, while the vectors indicate the direction and relative magnitude of the surface flow induced by the discharge.
This study developed a numerical model for Gyeonggi Bay that incorporates tide stations, a mooring site (M01), and the Ara sea-gate discharge condition to evaluate how gate releases affect local circulation. A comparison of monthly mean discharges from the Han River and the sea gate shows that the relative contribution of the Ara sea gate increases during winter, indicating a stronger influence in that season. Analysis of 40-day mean flow fields reveals that applying the discharge alters the spatial distribution of residual currents and streamline patterns at both the surface and bottom layers, and the changes are particularly clear near station P1, where differences in residual current vectors and the vertical structure of residual velocities demonstrate that sea-gate discharge is a key driver regulating local circulation and vertical exchange.
DOI Link: -
- Project
- Hydraulic Phenomena Survey of Incheon Port (Phase 3)
- Funded by
- Incheon Port Authority